Authors
Francisco d’Albertas, Gerd Sparovek,
Luis-Fernando G. Pinto,
Camila Hohlenwerger,
Jean-Paul Metzger
In brief
Recognized as one of the most effective measures against climate change and biodiversity decline, ecological restoration’s high costs can hinder its broad implementation. Our research shows that, by boosting crop yields and combined with earnings from carbon sequestration, restoration becomes a cost-effective approach in agricultural landscapes. Our findings may aid policymakers in promoting the wide adoption of restoration in agricultural landscapes, aligning climate mitigation, biodiversity conservation, and agricultural production.
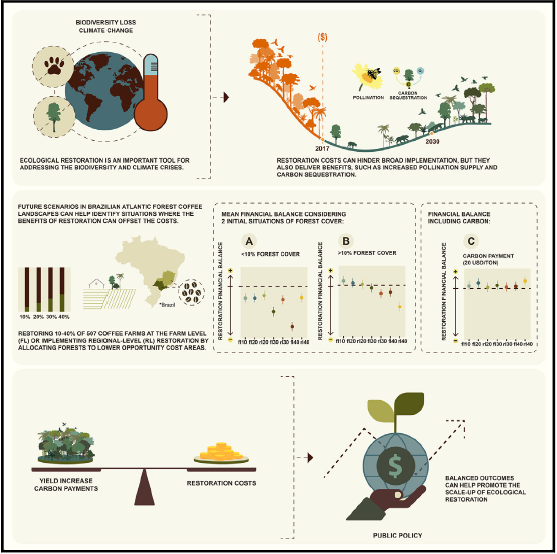
Graphical abstract
Highlights
SCIENCE FOR SOCIETY
Restoring degraded land is vital to addressing biodiversity loss and climate change. Agricultural landscapes comprise most of the degraded areas, making them crucial restoration targets. Yet high restoration costs (e.g., tree planting and forgone production) limit the upscaling of restoration by landowners. Economic benefits from landscape restoration, including through pollination-boosted crop yields and carbon credits, could encourage restoration. We show that, in coffee landscapes in the Brazilian Atlantic Forest, restoration boosts coffee yields via pollination, helping offset restoration costs. We found a positive balance when farms had more than 10% of existing forest cover and restoration aimed at less than 25%. Moreover, a CO2 value of at least USD 20/ton enhanced financial viability. Our findings may aid policymakers in promoting private land restoration, aligning carbon sequestration with biodiversity conservation and economic gains.
SUMMARY
Ecological restoration is vital for reversing biodiversity loss and climate change but faces cost-related implementation challenges, hampering global restoration efforts. Identifying when restoration within agricultural landscapes provides financial benefits—either by increasing crop yields or providing carbon credits—is imperative. Here, we developed restoration scenarios and estimated their financial outcomes to understand conditions where coffee yield and carbon-credit-derived restoration benefits compensate restoration costs in the Brazilian Atlantic Forest hotspot. We found that costs can be balanced by yield increases when farms already have >10% forest cover and restoration targets are below 25% forest cover. Additionally, a CO2 value of USD 20/ton would make restoration more attractive. This study demonstrates conditions where ecological restoration can be an economically viable approach for landscape management, concurrently promoting biodiversity conservation and climate mitigation. These insights hold significant strategic value for the scaling up of restoration initiatives to meet ambitious restoration commitments.
INTRODUCTION
Habitat loss1 and climate change2 threaten biodiversity globally, but achieving ambitious restoration targets can greatly reduce species extinction risk3,4 and simultaneously improve biodiversity conservation and human well-being.5–10 Many countries have made ambitious commitments as part of the United Nations (UN) decade on restoration, including to restore 350 Mha of degraded land by 2030 under the Bonn Challenge.11 Given that most degraded ecosystems are located within agricultural landscapes,12 restoration within agricultural areas will be a key part of achieving targets while addressing the global issues of habitat loss and climate change. However, restoration commitments face important implementation challenges. One of the major obstacles to balancing ecological, economic, and social interests is the high cost of restoration.13 These costs include direct restoration costs (e.g., for planting or site preparation), as well as protection costs and opportunity costs of forgone production. Recent work has highlighted that these costs can act as a major financial barrier to the wide-scale adoption of restoration.14,15 Nevertheless, restoration of natural habitat on farmland can also deliver ecosystem service and yield benefits, e.g., via enhanced natural crop pollination and pest control.16 Restoration can also deliver large carbon benefits. Tropical secondary forests in the process of restoration could sequester an average of 3.05 tons of carbon ha_1 year_1 from the atmosphere over 20 years.17 Carbon sequestration and storage is a critical regulation service that benefits people globally and can be traded in carbon markets, helping to compensate for restoration costs.
In the context of ecological restoration, Brazil emerges as a pivotal player,18 home to globally iconic biomes such as the Brazilian Atlantic Forest,19 a restoration hotspot.18 Additionally, Brazil stands out as one of the world’s foremost producers and exporters of coffee, a top 20 globally traded commodity.20 Ecological restoration can potentially benefit coffee production substantially. Several studies have demonstrated the importance of landscape native vegetation cover and the proximity between coffee fields and natural areas in modulating the flows of pollinators and natural pest controllers, which can increase coffee yield by 10%–30%.21–28 Restoration commitments in Brazil are guided by a legal obligation dictated by the Native Vegetation Protection Law (Law 12.651/2012), which drives and enforces where and how much native vegetation should be conserved, managed, or restored within farms.29,30 All rural properties within the Atlantic Forest must have a minimum of 20% of the area set aside as natural vegetation. This is composed of Areas of Permanent Protection (APPs), whose location is defined by legislation (environmentally sensitive areas, such as riparian areas, hilltops, and steep slopes) and Legal Reserves, which are allocated by landowners to achieve the minimum set-aside target of 20%.
Farmers who do not have the mandatory area covered with natural vegetation must restore it within 20 years or, in the case of Legal Reserves, compensate vegetation deficits on their own properties by trading with landowners with Legal Reserves surpluses. 29,30 The spatial information concerning farm boundaries and set-aside areas is uploaded to an environmental rural register platform named CAR (a Portuguese acronym), a public-access database.
Despite the evidence on the economic benefits, to our knowledge, few studies31 have incorporated the benefits of restoration in farmlands into cost analyses, nor have they explored the situations under which these benefits may prove substantial enough to overcome costs. Once the effects of restoration on yield and farm income can offset at least partially restoration costs, understanding the factors that play a role in this cost/benefit balance is key to informing landowners and supporting decision making and agri-environmental policies.
Here, we explore how much, and under which conditions, benefits from ecological restoration can offset costs in Brazilian coffee systems in the Brazilian Atlantic Forest hotspot. For this, we developed a set of scenarios with different on-farm restoration targets and calculated a detailed estimation of their financial consequences to understand how and when the costs of ecological restoration might be compensated by restoration-derived yield benefits and carbon credits. We considered restoration as the conversion of anthropic land uses to forest in selected areas. Importantly, as in our study region forests represent 100% of the native vegetation, the only option for meeting restoration targets is restoring forested areas. We found that restoration costs can be balanced by an increase in coffee yield, mediated by the increase in forest cover and pollination benefits when farms already had at least 10% forest cover at the beginning of the restoration process and the final forest cover after restoration did not surpass 25% forest cover. Besides, a CO2 payment of
USD 20/ton would enhance the positive financial balance. Our work can provide guidance for identifying circumstances where restoration benefits can outstrip costs, helping to promote restoration within agricultural landscapes.
RESULTS
Methods summary
To analyze the cost-benefit relationship for restoration actions, we designed eight scenarios with a time window of 20 years, based on the Native Vegetation Protection Law and more ambitious commitments (see ‘‘experimental procedures’’ section).
Our baseline scenario represents the 2017 land-use and landcover situation. In four additional scenarios, we set forest cover targets at the farm level, ranging from 10% to 40% with 10% increments, including targets above the 20% required by the law (farm-level restoration scenarios). Finally, to test the performance of designating restorations at a regional instead of farm-scale, we simulated three regional-level restoration scenarios where we combined the area of all focal farms and set three targets (20%, 30%, and 40%) that could be achieved at the regional scale. This regional approach enables restoration to be favored within farms with lower restoration costs, while high-cost farms compensate for their forest deficit (e.g., by purchasing Legal Reserve surpluses from other landowners in order to reach vegetation -cover mandates). For the farm and regionallevel scenarios, we used a prioritization algorithm32 that applies linear programming to find optimal solutions to achieve targets while minimizing restoration costs incurred by farmers. The scenarios were applied to 507 farms from 58 municipalities selected in one of the most traditional areas for coffee production in the country (Figure 1), responsible for 22% of the national production and _7% of the global production (2019 data from the International Coffee Organization and the Brazilian Institute of Geography and Statistics [IBGE]). This region is within the Atlantic Rainforest biome. Our focused farms ranged from 7 to 2,000 ha in size (mean, 233 ha).
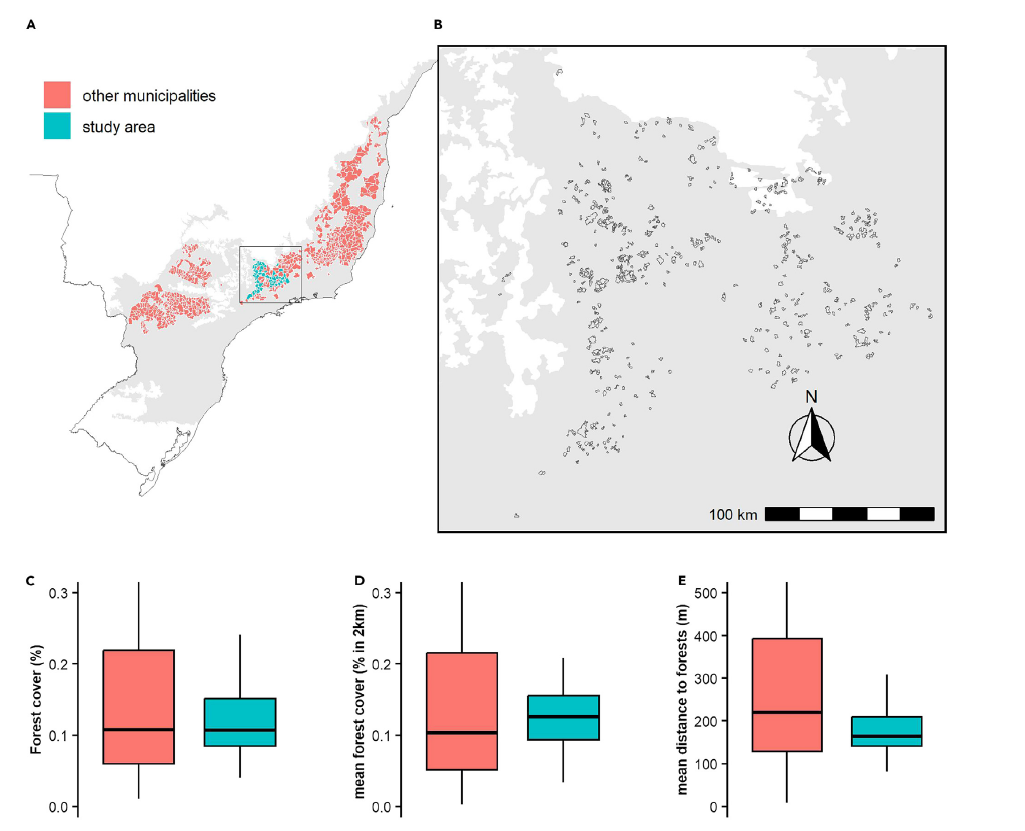
Figure 1. Study system map showing the municipalities where coffee is produced in the Atlantic Forest, the spatial distribution of our focal farms, and the distribution of forests within the municipalities
Municipalities (N = 622) within the Atlantic Forest (gray shade) that grow coffee (A); zoom on our study region (n = 58 municipalities) and focal farm boundaries (black outlines) (B). Although broadly similar to coffee-producing municipalities elsewhere in the Atlantic Forest, with nearly the same average forest cover (C), our focused municipalities have 21% higher median forest cover surrounding coffee fields (0.10 vs. 0.12; D), and coffee fields are on average 33% closer to forest patches (163.8 mvs. 219.3 m; E). The boxplots in (C)–(E) show the lower quartile, the median, and the upper quartile of the data distribution. Data from Gonzales- Chaves et al.31.
We estimated the immediate cost of allocating areas for restoration as a sum of restoration costs plus the opportunity cost of forgone production (Figure S1), hereafter named total restoration costs. Restoration costs over 20 years were estimated using a 30-m resolution raster containing the probability of natural regeneration or the necessity of actively planting seedlings33 as well as known restoration costs from projects within the Atlantic Rainforest14 (see ‘‘experimental procedures’’ section). Forgone production was calculated as a combination of the net present value (NPV) over 20 years of the main crops grown in the region and the spatial distribution of crops and pasture (see ‘‘experimental procedures’’ section for details). We also explored the consequences of restoration scenarios on coffee production, accounting for changes in the area under production and changes in coffee yield, which we parameterized using a coffee-yield model relating landscape metrics to coffee productivity (see ‘‘experimental procedures’’ section). To avoid double counting the economic consequences of restoration for coffee areas converted to forests both calculating the land opportunity cost and the total production changes, we have subtracted from the opportunity cost calculation areas of coffee that were replaced by forest. This model allowed us to realistically forecast restoration-derived changes in yield outcomes.
Our economic analyses also considered compensation payments, based on the Native Vegetation Protection Law, which established a market for Legal Reserves (see ‘‘experimental procedures’’ section). Total restoration costs, opportunity costs (derived from our yield model), and compensation payments were combined and will hereafter be referred to as total intervention costs.
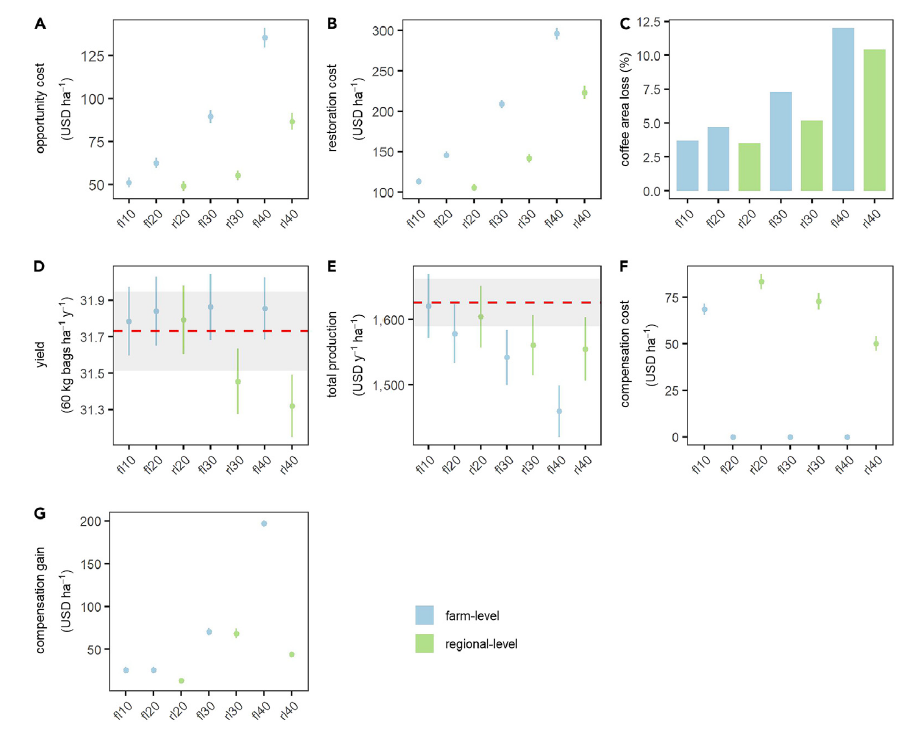
Figure 2. Average cost and benefits used to calculate the final cash flow after the restoration interventions in each scenario
Mean opportunity cost with forgone production of non-coffee products weighted by farm area (A); mean restoration costs over 20 years weighted by farm area (B); total coffee area loss in comparison with the baseline scenario (C); mean coffee field yield estimated with our spatial yield model (D); mean total coffee production estimated with the yield model weighted by farm area. To obtain production in USD, we have estimated total bags per property and multiplied it by theirmonetary value (see ‘‘experimental procedures’’ section for details) (E). Since the Brazilian legislation allows farms to trade forest deficits and surpluses to achieve forest cover legal requirements, we have estimated compensation costs, for farms with forest cover <20% after the restoration intervention (F) and compensation gains for farms with forest cover >20% after the restoration intervention (G). Both compensation costs and gain values are weighted by farm’s area. The weighting for monetary values was calculated by dividing individual values obtained for each of our focal farms by their area and we have used this weighted value to calculate the mean value per scenario represented in the plots. The red dotted line represents the baseline scenario, and the gray shade is the 95% confidence interval. FL, farm level; RL, regional level.
To calculate carbon sequestration, we used literature data to estimate aboveground17 carbon sequestered over 20 years in each scenario (see ‘‘experimental procedures’’ section). Financial consequences of farmland restoration Opportunity cost and restoration cost increased substantially with the percentage of restoration targeted in the scenarios (Figures 2A, 2B, S2A, and S2B). This is because, as the restoration target increased, low-opportunity-cost areas were quickly allocated, leaving only high-opportunity-cost areas such as coffee fields available for restoration (Figures 2C and S2C). Most scenarios showed marginal increases in yields compared to the baseline scenario (Figures 2D andS2D). However, for farm-level scenarios with restoration targets >20% (e.g., scenarios with farm-level restoration with 30% target and 40% target), yield increases did not offset the decrease in coffee- planted areas due to forest conversion. As a result, total production decreased in these scenarios (Figures 2E and S2E) that showed the highest loss of coffee-producing areas, with a more than 10% area loss (Figure 2C). Scenarios with restoration allocated at regional level with 30% and 40% targets (rl30 and rl40) had an unexpected average decrease in yield. These later scenarios resulted in concentrated forest patches, favoring situations of high forest cover (>50%) and very low coffee cover (<10%) (Figure S3), even though the average distance from the nearest forest did not vary significantly among scenarios (Figure S4). We stress the coffee fields sampled within landscapes composed of concentrated forest patched (and that we used to build our predictive yield model) showed lower yields (Figure S5), which may have influenced our results. Furthermore, the low coffee cover and the presence of forests in those situations suggest a lower productivity potential (see supplemental information) or the possibility that farms in such conditions invest less in management, potentially because coffee is not their primary activity.33 In the fl10, fl20, and rl20 scenarios, the increase in coffee yields from increased forest cover was substantial enough offset the loss of coffee-producing areas, resulting in an overall increase in total coffee production over 20 years (Figures 2E and S2E): fl10, fl20, and rl20. Under these scenarios, restoration actions were more economically advantageous and the relationship between costs and benefits was more balanced (Figure 3).
These results differ from the other scenarios, for which the larger areas of coffee converted to forest resulted in total production losses. In addition to the changes in production, we also computed forest compensation costs and gains—when farmers trade their Legal Reserve surpluses and deficits to achieve legal compliance (Figures 2F, 2G,S2F, and S2G)—which represents an additional revenue stream for farmers trading their forest surplus. However, compensation schemes overall represented a small fraction of the cash flow associated with the interventions (Figure 3), which were predominantly a result of changes in production, suggesting that losing coffee areas was the main financial challenge posed by restoration in the region.
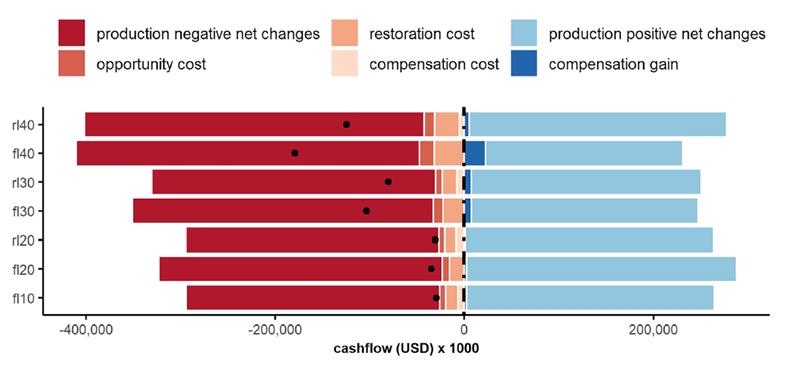
Figure 3. Distribution of costs and benefits per scenario
The costs are shown in shades of red (opportunity cost, restoration costs, negative changes in production, and compensation costs) and the gains in blue shades (compensation gains and positive net changes in production). The black dots are the net cash flow balances per scenario.
The overall profit-cost balance for all scenarios was negative. For example, achieving legal compliance by enforcing farm-level forest cover (fl20) without off-site compensation would imply an average cost of USD 63,719 per farm, or around USD 32 million in total to increase forest cover by _ 12,000 ha above the baseline (Figure 4A). Nevertheless, the net costs even for the most ambitious scenario represented less than 15% of the average farm’s revenue (Figure 4). When we considered the farm’s forest cover at the baseline, we found that, for farms that already had at least 10% forest cover, yield increase outweighed total intervention costs for some scenarios. As a result, there was an average increase of up to 1.7% in net income in comparison with the baseline scenario for scenarios fl10, fl20, and rl20 (Figures 5A, S6, and S7). For farms with forest cover below 10%, total intervention costs outweighed potential benefits from yield increases (Figure 5B). These results suggest that, for our study region, compliance with the Native Vegetation Protection Law would have net financial gains for farms with >10% of forest cover. However, farms with <10% forest cover and scenarios with more ambitious restoration targets (>20%) show a 3% to 16.6% decrease in farm income, reflecting the negative net change in production and the high restoration costs.
Farm-level vs. regional-level scenarios Regional-level scenarios on average led to lower net costs compared to farm-level scenarios but with a smaller overall area restored. Interestingly, the regional approach enabled legal compliance with lower costs even with compensation schemes concentrated in the region (‘‘local market,’’ where Legal Reserves are only traded between farms in the study area). The farm-level approach favored a higher forest cover (around 25% of the region; Figures 4A and S6) and a lower degree of fragmentation (in total number of fragments) but with forest cover more concentrated in smaller forest patches (Figure 6). For farm-level scenarios, restoration tended to be done in small areas and as an extension of existing fragments. With a 20% target—which would guarantee legal compliance without compensation outside our study region—the regional approach had an average cash flow 14% higher than the farm-level approach but restored only half the area (6,600 ha vs. 11,940 ha; Figure 4A). This was because the total forest cover considering all farms was already 14% at the baseline, so only an additional 6% forest cover was necessary to achieve the target. On the contrary, for farms with >10% forest cover, the farm-level approach (fl20) had a higher cash flow (Figure 4B) and is the win-win scenario, in which both benefits and forest cover are maximized.
Carbon credit
Compliance with the Native Vegetation Protection Law has the potential to remove 1.98–3.62 million tons of CO2 from the atmosphere in our focal farms for scenarios rl20 and fl20 respectively, which, as mentioned above, had different levels of on-farm restoration (total CO2 sequestered in each scenario available in Table S1). Current carbon prices (_USD 5/ton)34 would be insufficient to offset intervention costs for those scenarios (Figure S8).
However, considering a value of USD 20/ton of CO2 would offset restoration costs even for more ambitious scenarios (Figure 5C), which falls in line with estimated prices reported for the Atlantic Forest.35
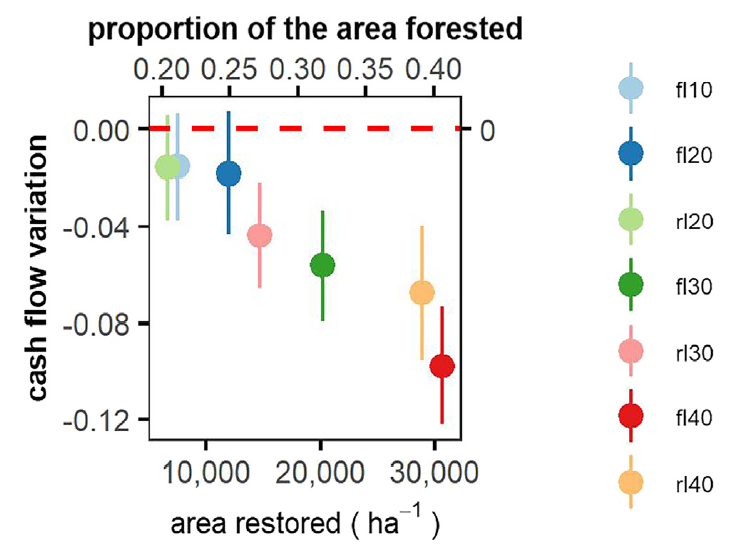
Figure 4. Mean cash flow variation estimates for different restoration scenarios
This figure shows the ratio of the mean cash flow (aggregated costs and benefits) per restoration scenario to the mean cash flow for the baseline scenario, represented by the red dotted line. The baseline scenario represents the current state of the system without any restoration interventions (y axis). The error bars represent the 95% confidence interval of the mean cash flow variation estimates.
DISCUSSION
While a growing body of evidence highlights the economic advantages of ecological restoration,15,31 a limited number of studies have integrated these benefits into cost analyses or investigated the circumstances under which these benefits can outweigh restoration costs (but see Bradbury et al.31). To address this knowledge gap, we developed restoration scenarios and conducted financial assessments to elucidate the conditions under which restoration costs could be outweighed by the benefits derived from increased yields and carbon credits.
Our scenarios suggest that, over 20 years, the costs of forest restoration within farms—including direct costs, opportunity costs, and changes in production—can be offset by restoration- driven increases in coffee yields. This occurs particularly when farms have a baseline forest cover >10%. Those farmers who had historically deforested a smaller fraction of their land and thus held smaller legal forest cover deficits would incur a net financial benefit from complying with legal restoration mandates, whereas farmers who had deforested more land faced a financial burden. A carbon remuneration of USD 20/ton of CO2 would also allow most scenarios to achieve no net costs. We identified a clear threshold at around 25% forest cover, inclusive of remnant and restored forests. Above this threshold, additional restoration increased costs substantially. More ambitious restoration targets (30% or more) surpassing this forest cover threshold incurred a net financial loss for farmers of up to 16% of their farm’s income. By contrast, farms that transitioned from 10% to _25% forest cover had favorable financial outcome. This was because, first, the presence of some baseline forest cover reduced restoration costs by minimizing the total area requiring restoration while also increasing the likelihood of natural regeneration, a more cost-effective approach than active restoration methods.33 The upper limit of _25% forest cover is likely due to the availability of low opportunity cost areas, which are typically prioritized for restoration and become scarce beyond this threshold, meaning additional forest cover above this point incurs substantial production losses. When comparing the cost-benefit of targeting restoration at the farm or a regional planning, we found that, while a regional approach met restoration targets with reduced costs, targeting restoration at the farm level led to disproportionally higher forest cover and even a higher net benefit (when farms had >10% baseline forest cover).
The 25% forest cover threshold is near the 30% biodiversity extinction threshold for the Atlantic Forest36 and within the range of vegetation cover needed to maintain biodiversity in working landscapes (20%–40%).37,38 For more permeable matrices such as coffee, the threshold is estimated to be closer to 20%.39 Our results support the financial feasibility of maintaining this minimal amount of native vegetation (around 25%37,38), suggesting these more economically advantageous restoration scenarios may be sufficient for reducing extinction debts for threatened biodiversity within landscapes. Compliance with the Native Vegetation Protection Law thus not only could contribute to reducing extinction risk but also can provide economic benefits through productivity gains mediated by ecosystem services provisioning.
Furthermore, the restoration-mediated benefits to yield we observed on our farms are likely to be higher in other regions. Our focal municipalities already have high forest cover surrounding coffee fields, which were, on average, closer to forest patches in comparison to other areas (Figure S10A). Coffee yields in local experiments were estimated to be 15%–20.8% higher on fields closer (<800 m)26,40 or in contact with forests.41 Moreover, while, in our study region, the autogamous Coffea arabica breed is grown, some municipalities elsewhere also grow pollinator-dependent Coffea canephora, which is expected to benefit more from pollination services delivered by forests31 (Figure S10B). Thus, our results are likely to be conservative estimates of derivable restoration benefits; analysis with C. canephora would likely report an even more positive outcome. Beyond coffee, several other crops can benefit from restorationderived ecosystem services and may thus show enhanced yields from an increased forest cover within agricultural landscapes, including soybean, rapeseed, apples, and many other fruits that are benefited by pollination.42 Further studies exploring restoration costs and benefits for these crops are now needed in different regions in Brazil and beyond. Crucially, such studies must consider forgone production within restored agricultural areas taken out of production, as we have done.43 Nevertheless, coffee-related research indicates similar outcomes may be expected (e.g.,26,44,45).
Although our results offer important insights on the feasibility of restoring agricultural landscapes, we highlight some limitations. First, we assumed that the yield benefits provided by restored areas were immediate. However, even though newly restored areas can act as habitat for pollinators,46–48 benefits might take time to accrue.49–51 Second, our costs were based on a literature compilation of restoration actions and opportunity cost estimations, disregarding transaction costs; however, costs of similar restoration are a knowledge gap in the restoration literature. 52 Third, our optimization model did not consider the level of forest aggregation/fragmentation when allocating new forest pixels, resulting eventually in high levels of within-farm fragmentation, which might not be ideal, or even realistic, for farm practice, especially considering biodiversity conservation issues.53
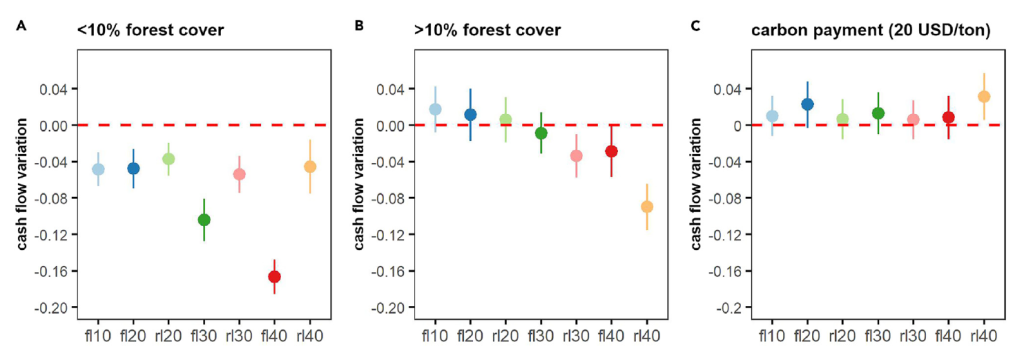
Figure 5. Mean cash flow variation estimates for different restoration scenarios
Farms were divided into two groups based on their vegetation cover: farms with >10% cover prior to restoration (N = 253) (A), and farms with%10% cover (N = 254) (B). For each group, we calculated the mean cash flow variation (aggregated costs and benefits) between the present scenario and the restoration scenarios, expressed as a ratio of the mean cash flow for the baseline scenario (represented by the red dotted line). The error bars represent the 95% confidence interval of the mean cash flow variation estimates. We also evaluated the change in cash flow variation achieved by remunerating farmers for the amount of CO2 sequestered by the restored areas, using a value of USD 20/ton (C).
Fourth, we acknowledge that our model’s assumption of a linear relationship between yield and forest cover may oversimplify the intricate dynamics between these variables once we have evidence that yield can be low with high forest cover541 (and low coffee cover). More complex relationships may better describe forest-cover-yield dynamics. Regarding the model’s complexity, it is worth noting that there is no publicly available dataset with management factors such as fertilization use and other inputs.
Consequently, we did not incorporate these factors into the model and assumed homogeneity in management practices across farms in our region. While this assumption holds reasonably true for most of our study area, it introduces a higher level of uncertainty into the model and may limit its applicability to regions with less-uniform management practices, as variations in management can substantially influence yields. Further, we did not consider below-ground biomass in the analysis of carbon sequestration potential, which could contribute even more to making the financial balance positive when incorporating carbon payments. Last, while we acknowledge that climate change and coffee price variations are expected to affect our study region, at a regional scale study such as ours, these factors are expected to have a relatively homogeneous effect.55 While these limitations may affect the precision of our estimations, potential changes in the economic balance of costs and benefits should not alter the ranking across scenarios and thus are unlikely to significantly alter our conclusions, although we note that future research could explore the potential effects of climate change and price variations on restoration cost-benefit analyses, as well as considering other limitations raised.
Farm-level vs. regional approach We found that a regional planning restoration governance tool would be a useful restoration strategy for supporting farms with low forest cover (<10%) in achieving 20% targets. In such a situation, the regional approach enhanced cash flow relative to farm-level allocation. This was true even when compensation schemes—when landowners with farms below 20% forest cover pay to compensate their forest debt elsewhere— concentrated on the region. Regional planning also favored larger and more concentrated forest patches, which can be beneficial for biodiversity.56 However, regional scenarios with 30% and 40% forest cover targets resulted in decrease in yields, consistent with previous studies in the Atlantic Forest region that have observed similar yield decrease in situations of very high forest cover.54 The coffee fields sampled in high-forest-cover contexts that were used in building our predictive yield model also exhibited lower yields. Hence, it is plausible that the data employed in model calibration contributed to observed yield decrease with higher forest cover. Alternatively, complex multitrophic interaction between natural enemies may be responsible,23,57 since forests can contribute to coffee loss by reducing pest control. Further investigation is warranted to determine whether our observed yield decrease stems from modeling inaccuracy, an ecological phenomenon, or other potential factors such as farmer management decisions. For instance, some farmers may prioritize other activities on their farms over coffee cultivation, which could also contribute to fluctuations in yield. Currently, there are no established mechanisms for regional planning30; for instance, farmers are allowed to trade Legal Reserves across the entire Atlantic Forest. However, our results indicate that restoration planning would still be cost-effective if applied at a finer scale. Moreover, while our prioritization approach only minimized costs, regional policies could also better design landscapes to enhance increasing yield benefits and creating landscapes to optimize service provision too.
On the other hand, we found the farm-level approach resulted in greater overall forest amounts, with forest cover more evenly spread among farms. For less sensitive species, habitat amount per se—even if spread over a mosaic of forest patches—can be more important than fragment size.38 Similarly, for ecosystem services provided by mobile organisms, we expect this approach would reduce the distance between natural areas and crops58,59 while also presumably reducing the biased location of natural vegetation exclusively on marginal areas for agriculture, which does not necessarily overlap with priority biodiversity conservation areas.18,60
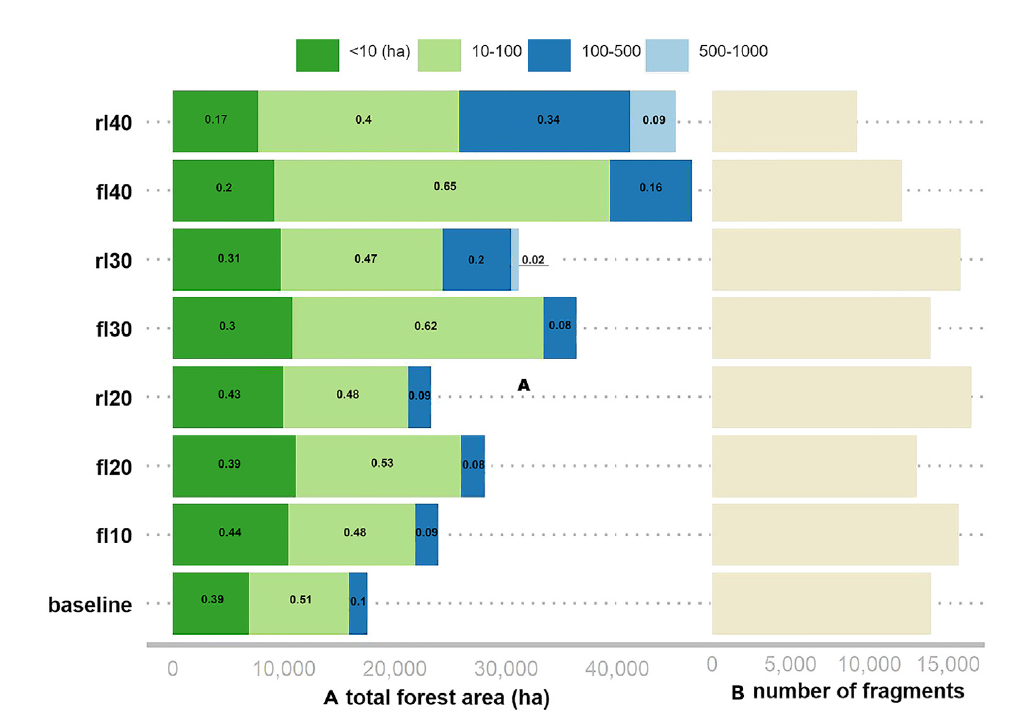
Figure 6. Distribution of forests in each scenario
Total forest area (restored and remnant forest combined) within farm boundaries. The proportion of each size class area against total forested area is indicated in the ratios within the bars (A) and total number of forest fragments (B). Fragments in (A) were grouped into five size classes based on their area, in hectares, as shown in the color legend.
Carbon credit and additional governance actions
Although we estimate that there can be economic benefits with restoration, these are relatively long term, whereas the costs are immediate, discouraging farmers from restoring their land. Carbon markets can be a complementary strategy to stimulate farmers to set aside land for conservation. However, current CO2 prices averaging _USD 5/ton34 would not be sufficient for offsetting net intervention costs (Figure S8). A carbon price of USD 20, however, as suggested for the Atlantic Forest for restoration projects (USD 18–20/ton of CO2 removed),35 would turn most scenarios cost-neutral by increasing restoration net benefits and counterbalancing costs. Our estimates converge with wider findings that higher carbon prices (USD 20–50) will be needed to help make tropical forest restoration economically viable for landowners.61,62 Another relevant aspect to consider is that the net cash balance is not homogeneously distributed among farms, making fixed carbon prices unfair. A better strategy would be to remunerate farmers proportionally to their restoration expenditures, although such a policy would be a technical and socioeconomic challenge since it would require paying neighbors different values based on their forecasted restoration expenditures.
It is also important to increase financial flows toward restoration by accounting for other ecosystem services,5–8,10 such as increased soil quality6 and water supply,63 which can further increase coffee yield. Policies that account for multiple ecosystem services, such as payment for ecosystem services, are strongly likely to make restoration remunerative.15,31 Such additional restoration revenue streams are likely to be especially important given that opportunity costs (i.e., forgone revenues) from converting agricultural land to forest cover comprised the most significant restoration cost in our scenarios. While our restoration simulation focused on native forests restoration, the expansion of coffee agroforestry could also further help to dilute substantial opportunity costs64,65 while still hosting 65% higher species richness than monocrop plantations.66 A mixed scheme, with forests and agroforestry, would help dilute restoration costs. A consortium of commercial eucalyptus trees for wood production mixed with native species is also a viable option67 and can reduce restoration costs by 44%–75%.68 In conclusion, our results show that, for a traditional coffee-producing region within the Brazilian Atlantic Forest, a commandand-control governance tool that enforces restoration within farms does not necessarily incur financial losses. Depending on the initial vegetation cover and the restoration target, such a tool can even provide marginal benefits for farmers, notwithstanding additional contributions to biodiversity conservation in working landscapes and the capturing of relevant amount of carbon.
Nevertheless, substantial work is needed to enable farmers to recognize and take advantage of such benefits. In that direction, additional policies such as carbon markets and diversified financing mechanisms are also vital to enhancing the feasibility and attractiveness of restoration actions for farmers. Our illustrative study case on how targeting restoration will affect agricultural production within working tropical landscapes can be applied elsewhere to understand how much and under which conditions ecosystem restoration benefits can offset costs.
Fonte: One Earth (2023), https://doi.org/10.1016/j.oneear.2023.11.007
Acesse o artigo original: https://www.cell.com/one-earth/abstract/S2590-3322(23)00510-9?_returnURL=https%3A%2F%2Flinkinghub.elsevier.com%2Fretrieve%2Fpii%2FS2590332223005109%3Fshowall%3Dtrue